How to create Cluster, marker annotation and popover using Mapbox
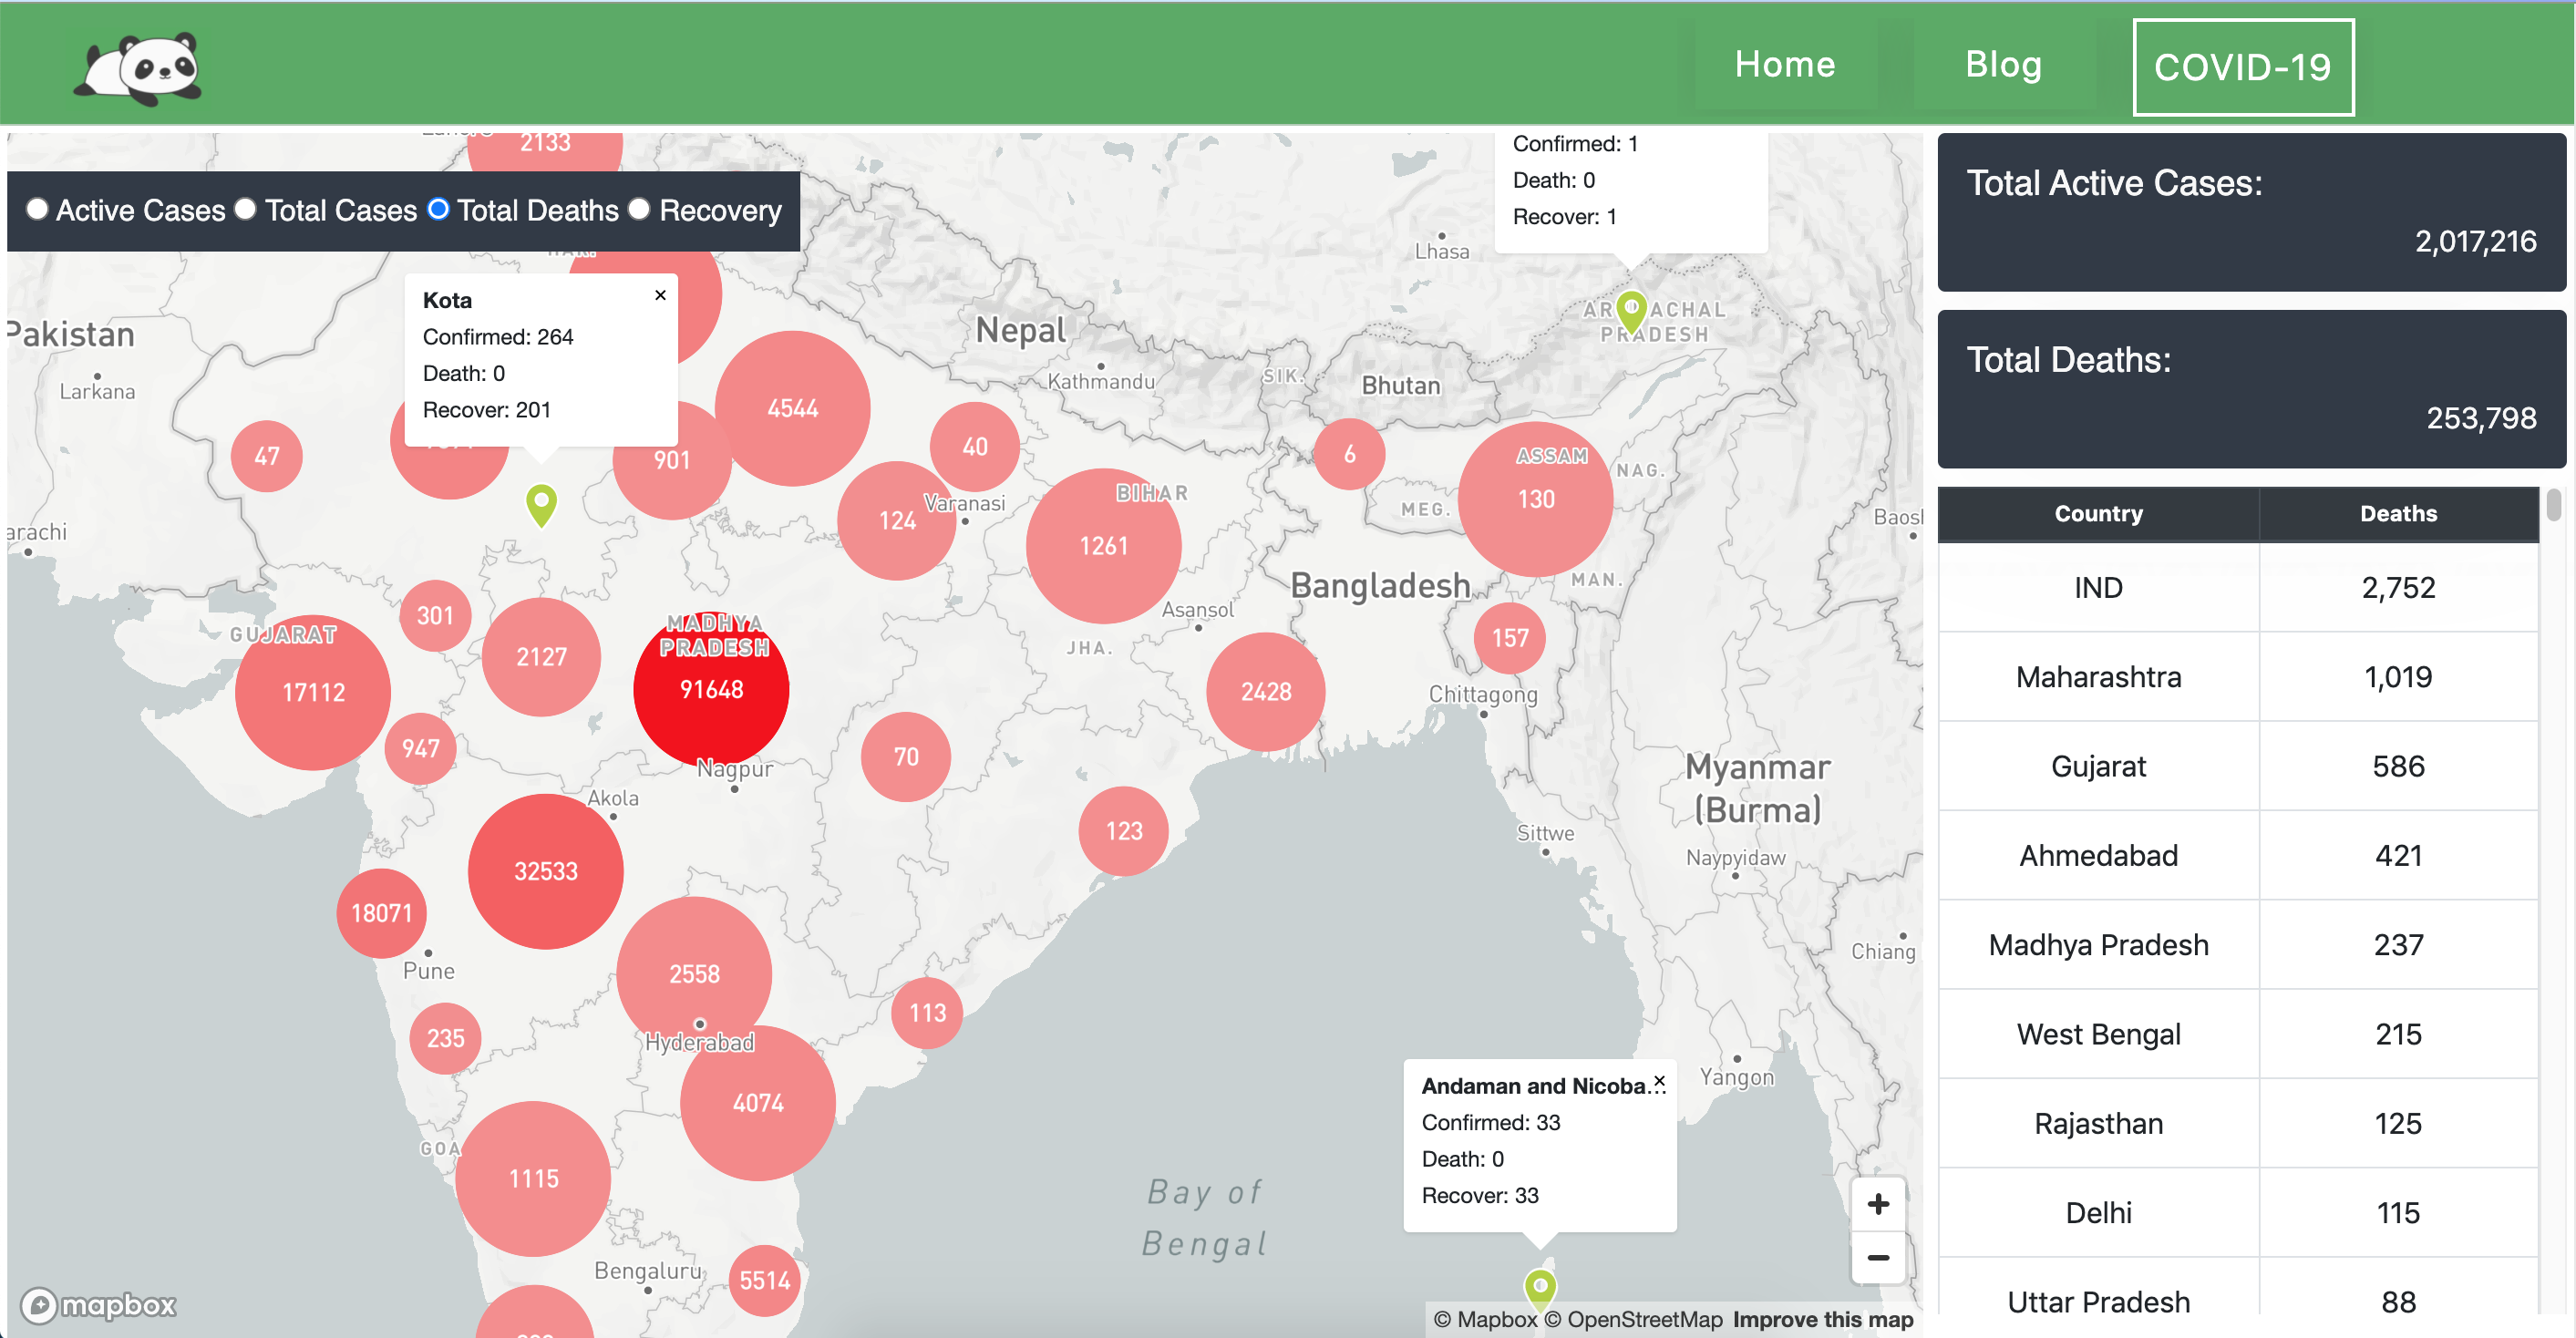
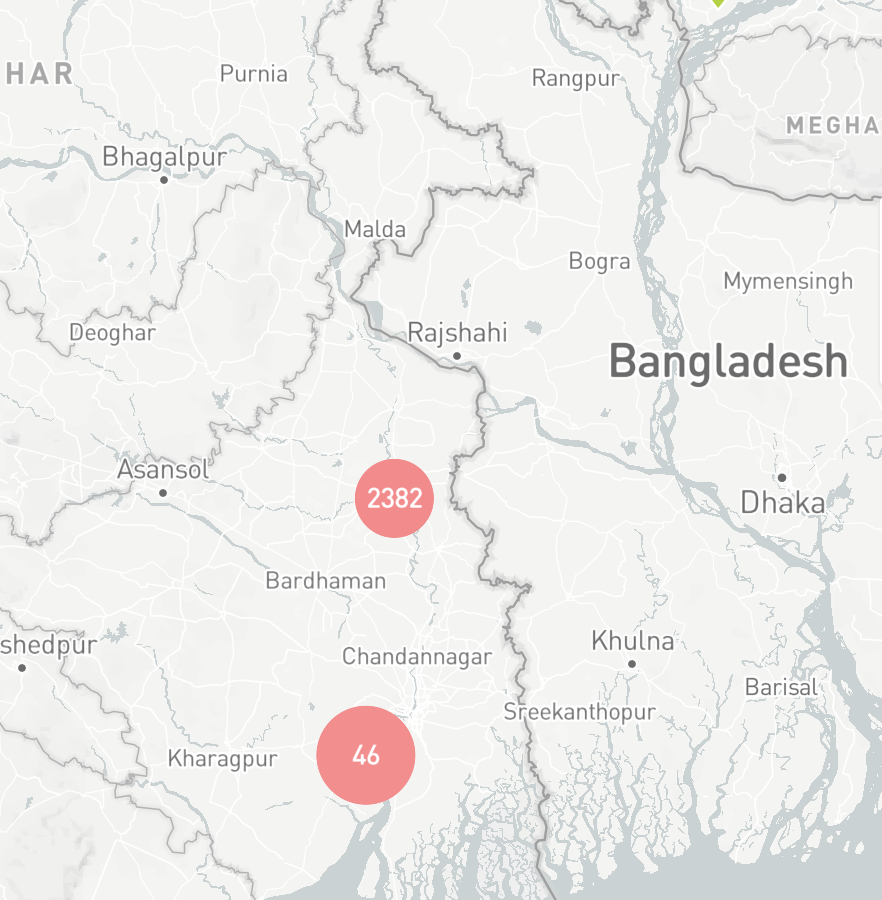
Using Mapbox there are many scenario when we need to show a huge data set on the map. Markers will overlap each other, and the map will look very cluttered. Data clustering is one of the best options to represents large data on the map and user experience will be high as well.
Clustering data based on map cameras zoom level is a good way to provide user with a cleaner UI experience and less overwhelming location data experience.
I have created a cluster-based Map experience using the COVID-19 data set, and the same I am going to write, How I did it. Before jumping into cluster and marker, if you are interested to understand Map layer and data set preparation using geoJSON, I would suggest going through my previous blog. Also for Cluster experience, have a look at the live COVID-19 data showing on Map.
The following items are going to cover in this blog -
- Data set creation using Python script and transform to geoJSON
- Initializing Cluster layer using SuperCluster module in mapbox-gl
- Load and configure data on a map based on map camera zoom level
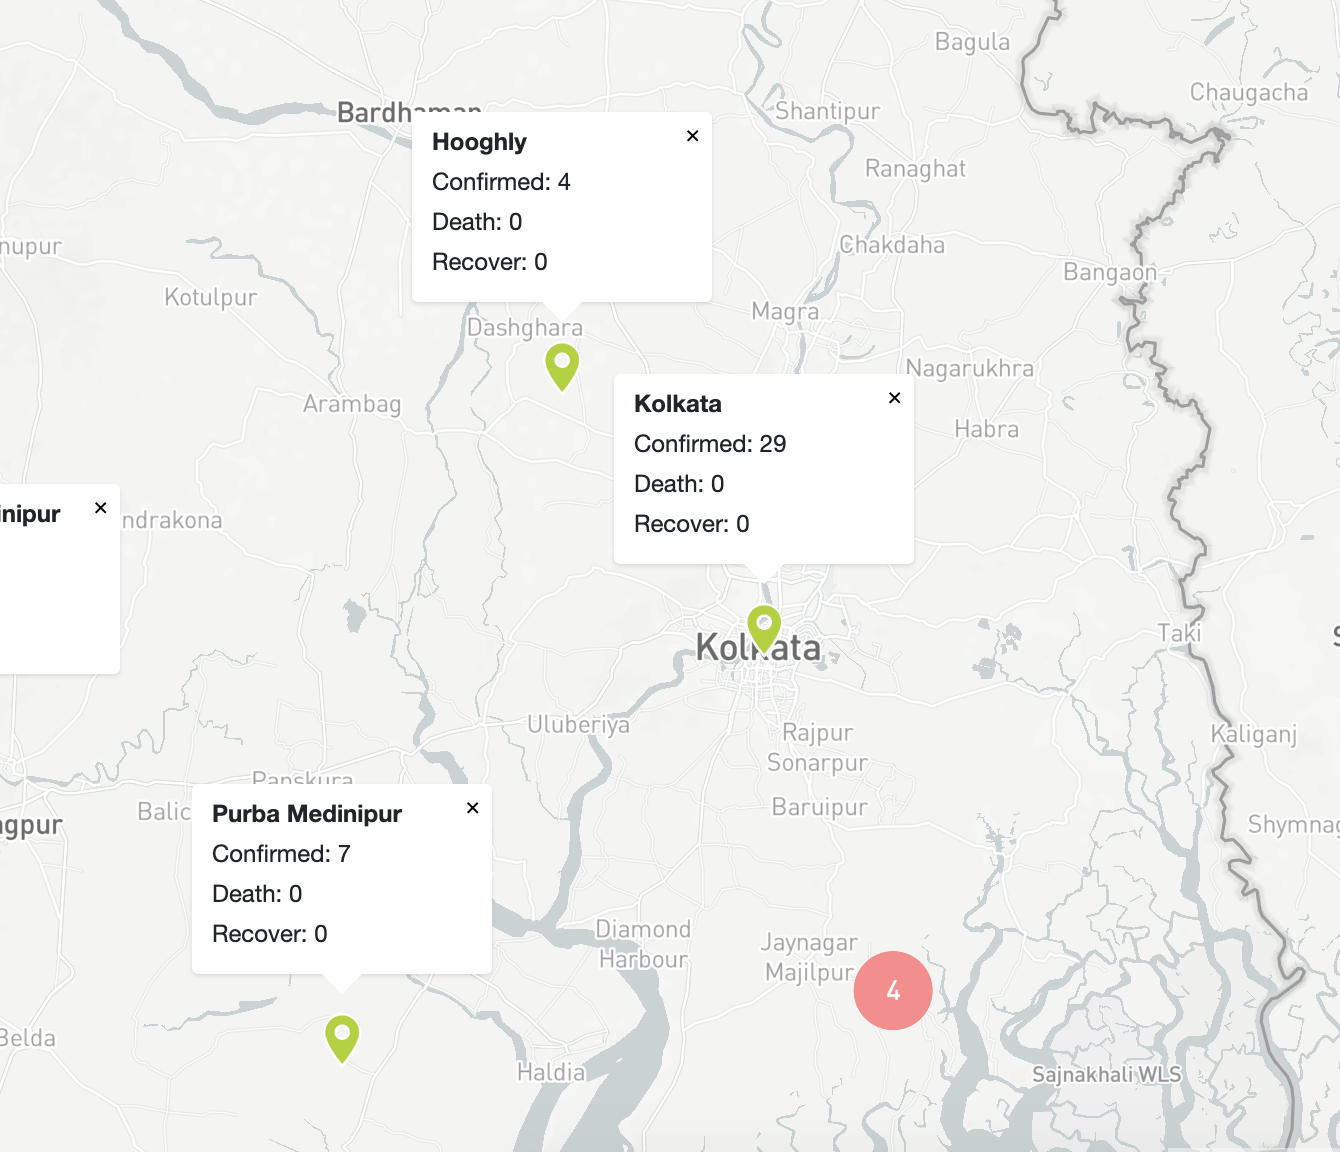
- Show annotation and popover on the map
- Summary
Data set creation using Python script and transform to geoJSON
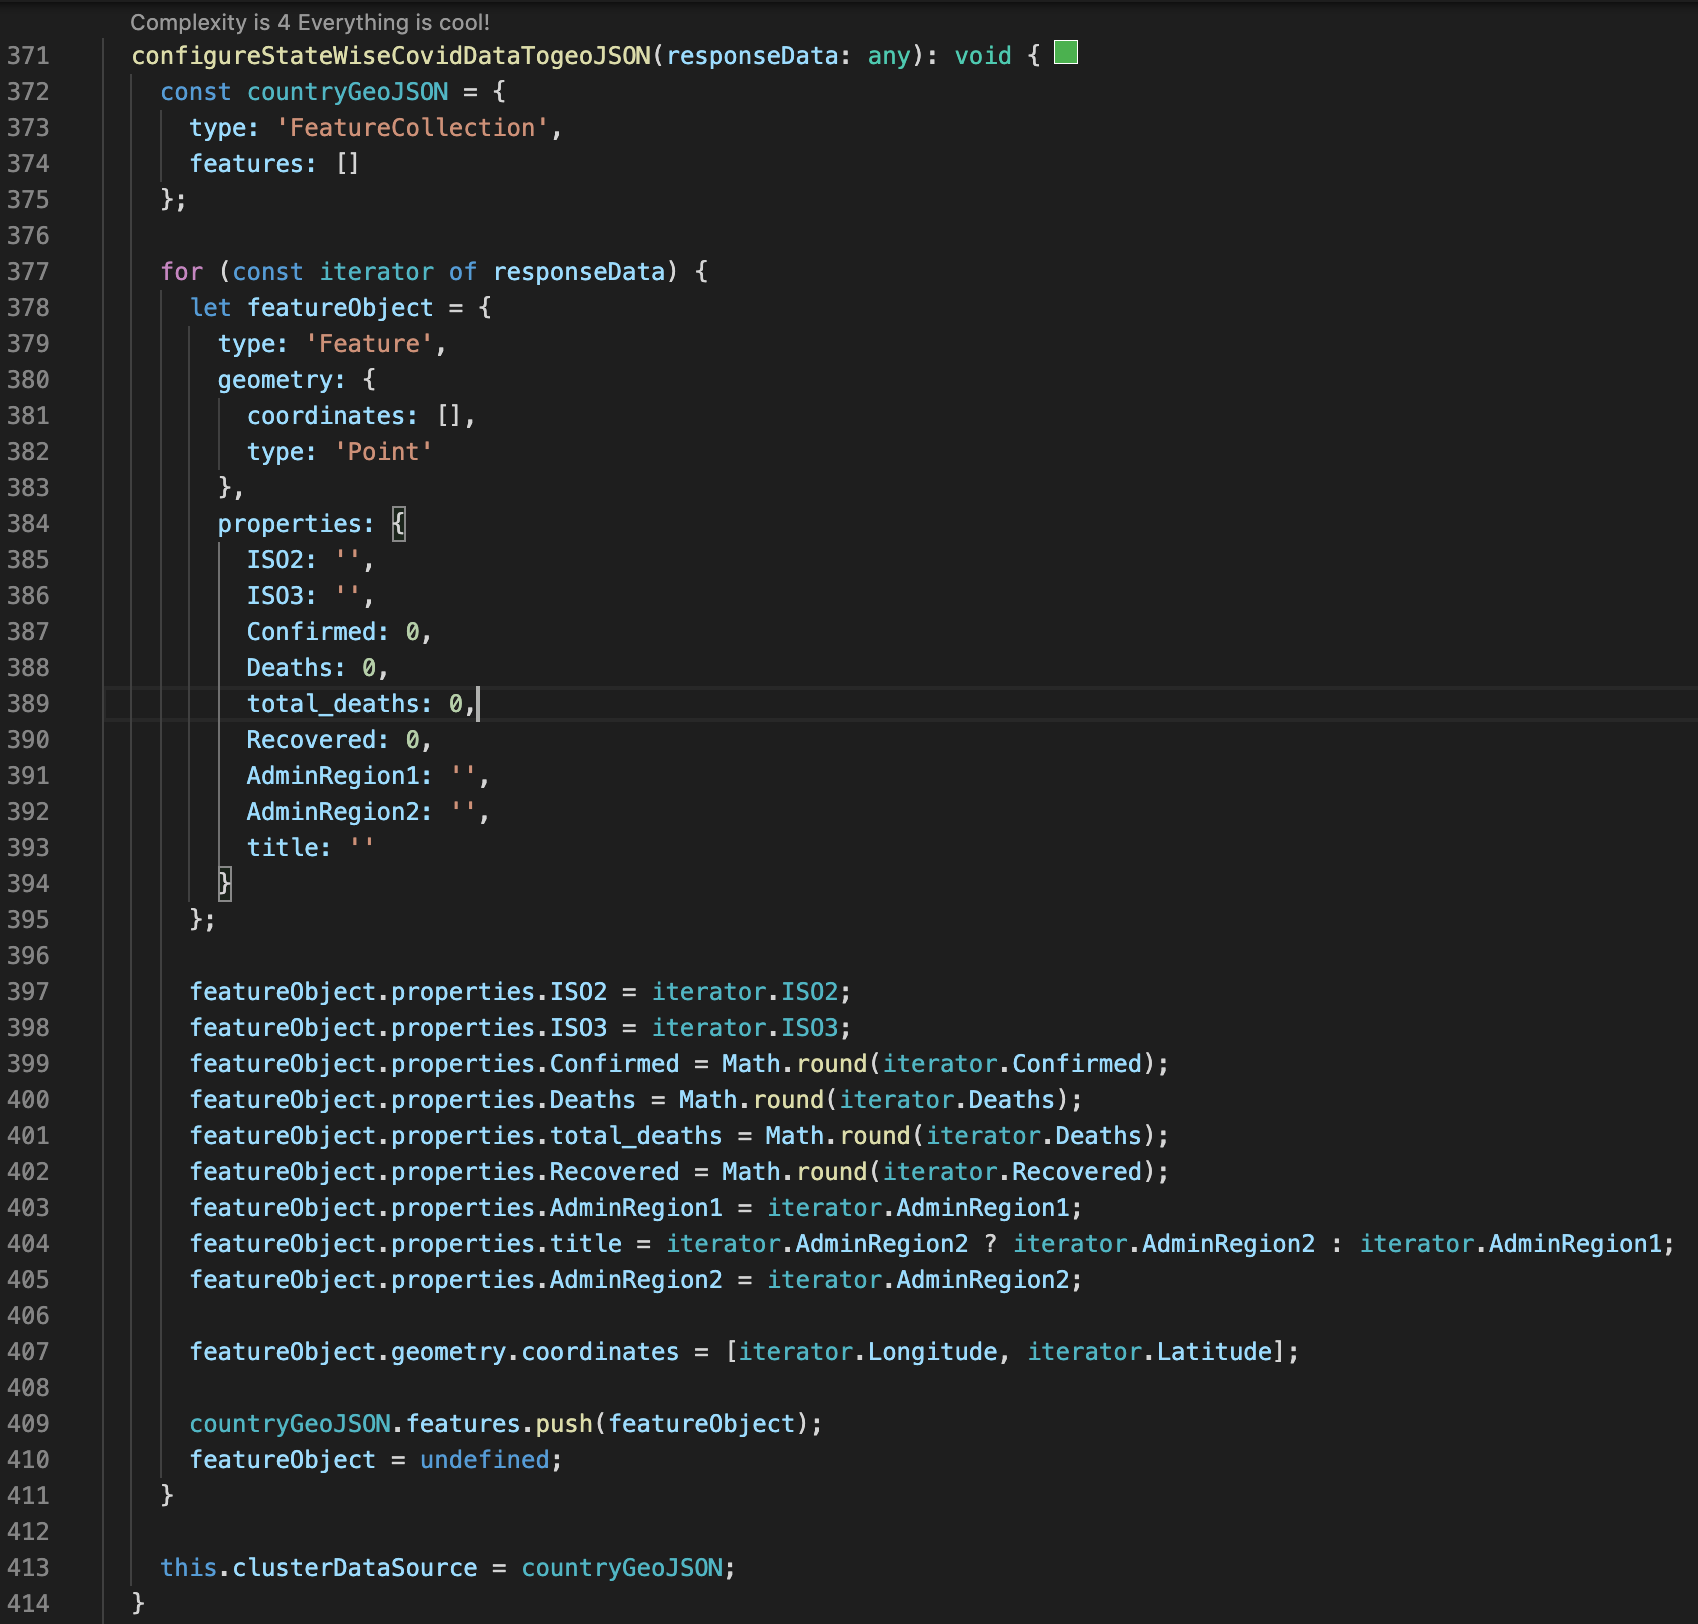
To create Cluster data, first we need a JSON data in geoJSON format, and my targetted JSON will look like following -
let featureObject = {
type: 'Feature',
geometry: {
coordinates: [],
type: 'Point'
},
properties: {
ISO2: '',
ISO3: '',
Confirmed: 0,
Deaths: 0,
total_deaths: 0,
Recovered: 0,
AdminRegion1: '',
AdminRegion2: '',
title: ''
}
};
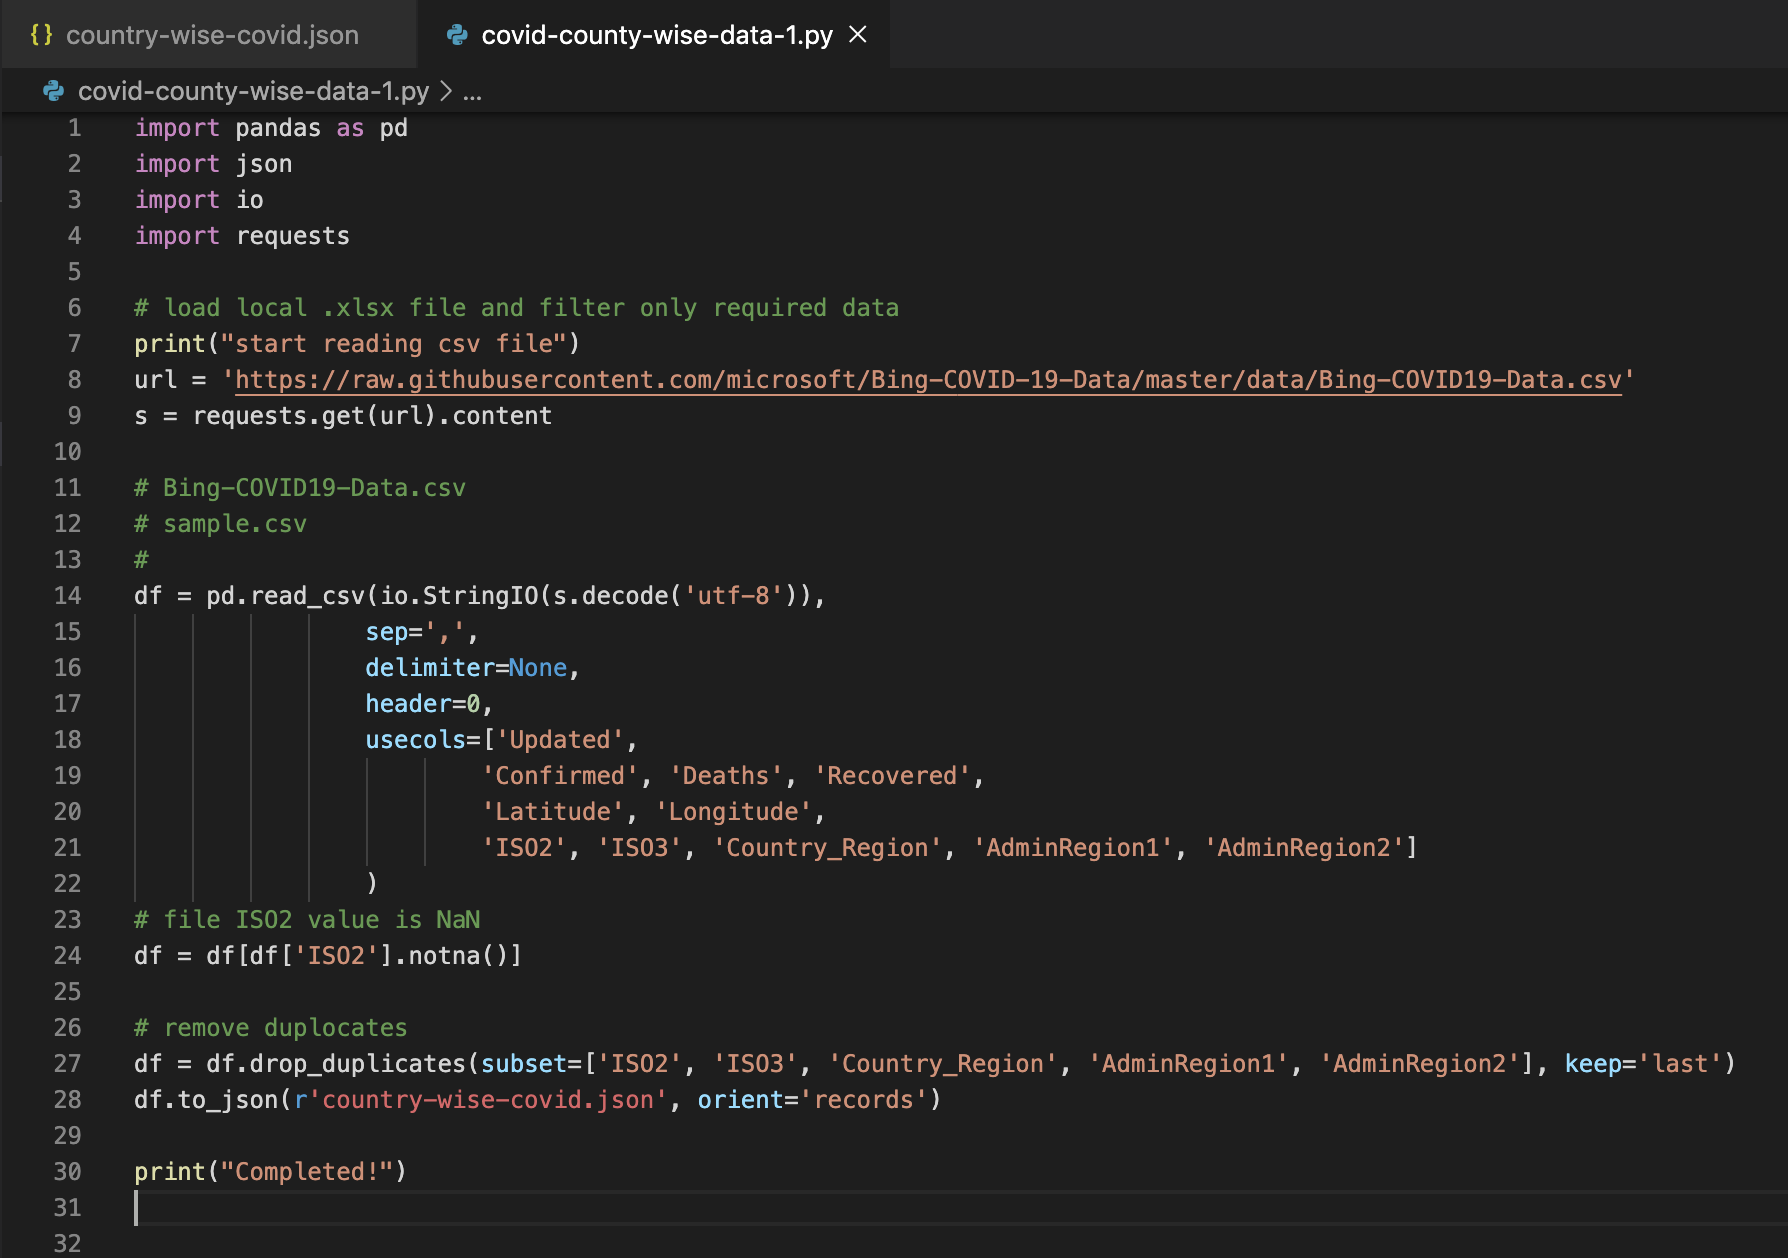
To get the data source, I have used https://github.com/microsoft/Bing-COVID-19-Data/tree/master/data to get the CSV file. Then I ran a Python script to get CSV data into a JSON file based on my needs. Here the below is the python script (CSV to JSON using HTTPS connection) with pandas and request library to get the desire data -
Once I got the country-wise-covid.json file, I turn it into a geoJSON file -
Initializing Cluster layer using SuperCluster module in mapbox-gl
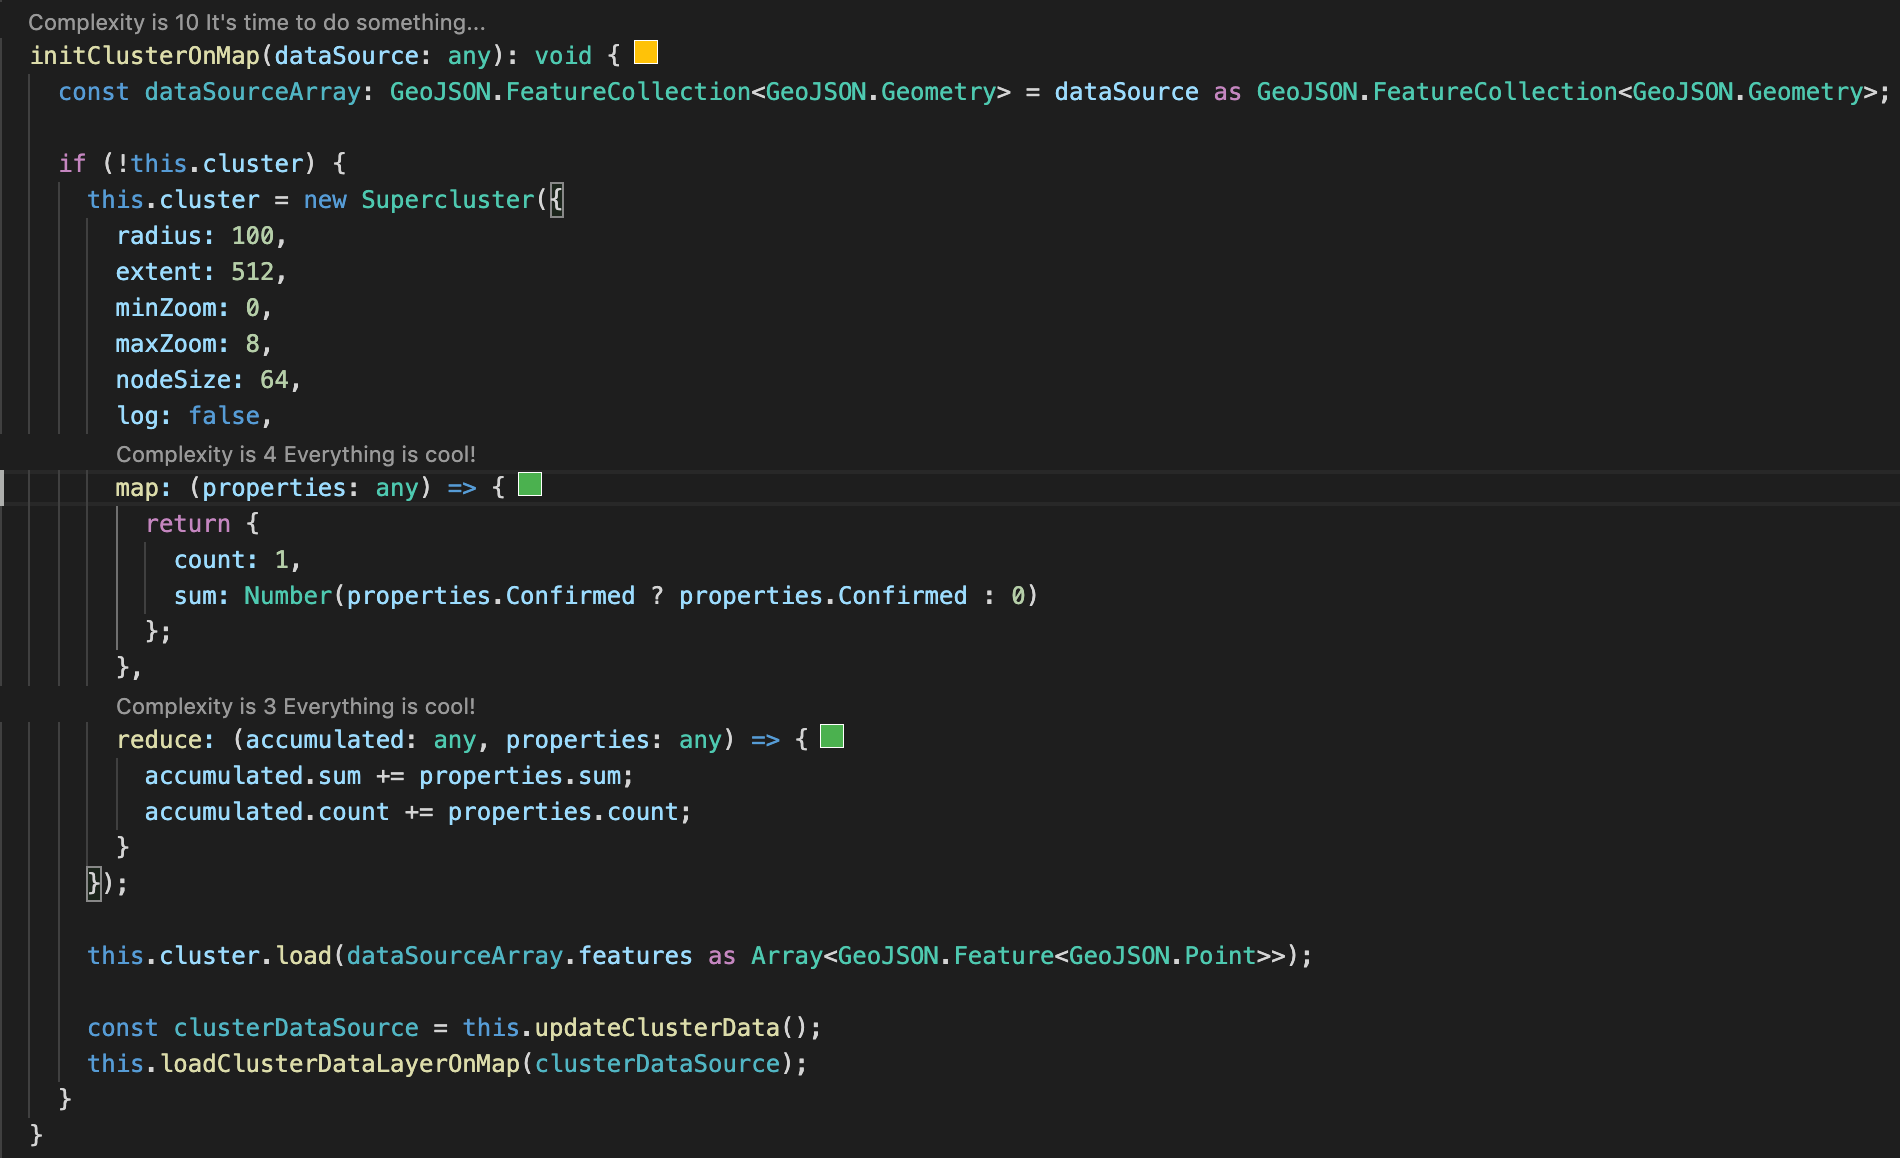
Now next step is to use the geoJSON to cluster and initialize it with minZomm, maxZoom, radius, and the number you wanted to on top of the cluster circle. For to get the nearest locations confirmed cases count, I have used to map and reduce function to get the accumulated numbers.
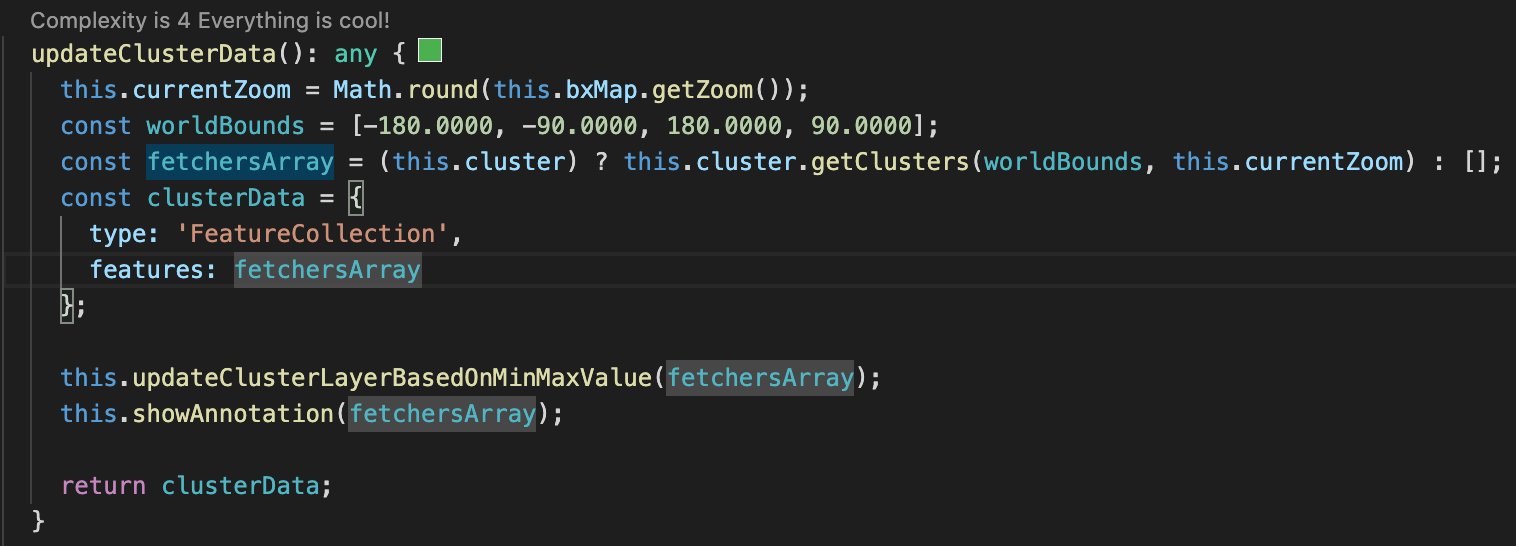
Then update cluster data based on world boundaries or countries' boundaries, depends upon your needs. (In my case it is word boundary) Also, set the cluster layer and data source for the Cluster as well.
To handle cluster click event on map, need to add click event on map cluster layer and based on zoom level, find nearest cluster and show next child. If any of parent cluster node does not have any clild node, that means its a point and show marker with pop over.
handleClickEventOnCluster(): void {
this.bxMap.on('click', 'clusters', (e) => {
this.isClusterOn = true;
this.selection = 'death';
const cluster = this.bxMap.queryRenderedFeatures(e.point, { layers: ['clusters'] });
const clusterFeature = cluster[0];
const clusters = this.findNearestCluster(this.bxMap, clusterFeature);
const nearestCluster = clusters[0];
let nextZoomLevel = this.cluster.getClusterExpansionZoom(nearestCluster.id, this.currentZoom);
if (Number.isNaN(nextZoomLevel)) {
nextZoomLevel = this.bxMap.getZoom() + 2;
}
const geomertyData: any = cluster[0].geometry;
const coordinates = geomertyData.coordinates;
if (clusterFeature && clusterFeature.properties.cluster) {
this.bxMap.flyTo({
center: coordinates,
around: e.lngLat,
zoom: nextZoomLevel,
bearing: 0
});
}
});
}
getGeoJSONDataBasedOnBoundary(map: any): any {
const covidDataArray: Array<any> = [];
const south = map.getBounds()._sw;
const north = map.getBounds()._ne;
const bounds = [south.lng, south.lat, north.lng, north.lat];
const fetchers = (this.cluster) ? this.cluster.getClusters(bounds, this.currentZoom) : [];
fetchers.forEach((eachObject: any) => {
if (eachObject && eachObject.id) {
const children: Array<any> = this.cluster.getChildren(eachObject.id) as Array<any>;
// tslint:disable-next-line:prefer-for-of
for (let i = 0; i < children.length; i++) {
const child = children[i];
if (child && child.id) {
const leaves: Array<any> = this.cluster.getLeaves(child.id, Infinity, 0) as Array<any>;
// tslint:disable-next-line:prefer-for-of
for (let j = 0; j < leaves.length; j++) {
covidDataArray.push(leaves[j]);
}
} else {
covidDataArray.push(child);
}
}
} else {
covidDataArray.push(eachObject);
}
});
}
findNearestCluster(map, marker): any {
const clusterSelected = marker;
const south = map.getBounds()._sw;
const north = map.getBounds()._ne;
const bounds = [south.lng, south.lat, north.lng, north.lat];
let fetchersArray;
try {
fetchersArray = this.cluster.getClusters(bounds, this.currentZoom);
} catch (error) {
if (error) {
const zoomValue = this.bxMap.getZoom() + 0.5;
this.currentZoom = zoomValue;
fetchersArray = this.cluster.getClusters(bounds, this.currentZoom);
}
}
const currentClusters = fetchersArray;
const compare = {
lng: clusterSelected.geometry.coordinates[0],
lat: clusterSelected.geometry.coordinates[1]
};
const minClusters = currentClusters.map(cluster => {
const lng = cluster.geometry.coordinates[0];
const lat = cluster.geometry.coordinates[1];
return {
id: cluster.properties.cluster_id,
geometry: cluster.geometry,
value: Math.pow(compare.lng - lng, 2) * Math.pow(compare.lat - lat, 2)
};
});
return minClusters.sort((a, b) => {
return a.value - b.value;
});
}
Show annotation and popover on the map
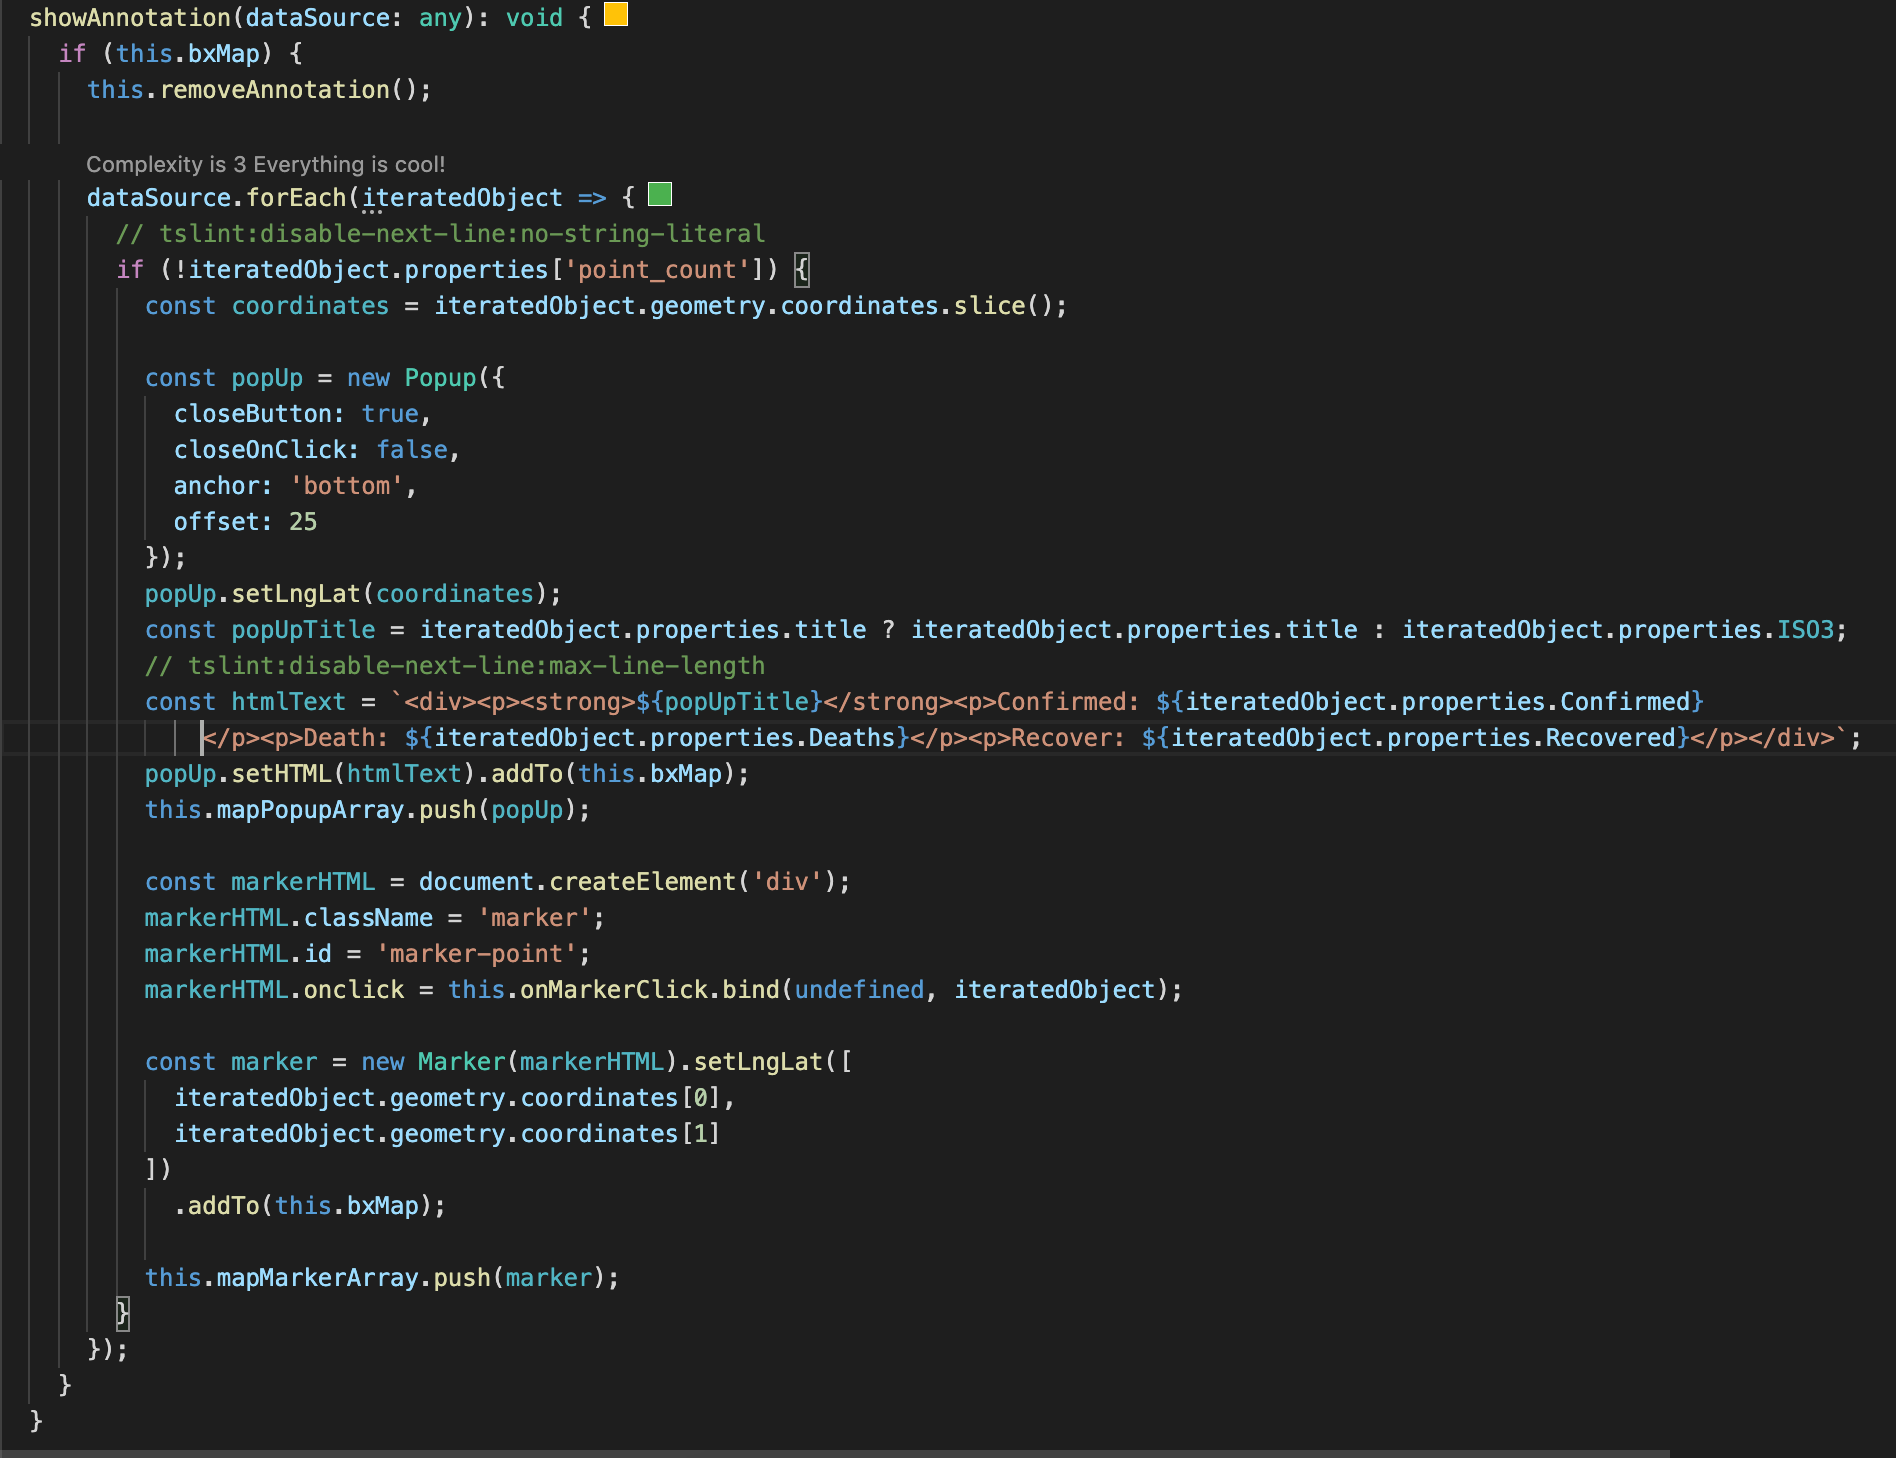
To show marker on the map, and popover on to of the marker, you can use the following code -
And that's it. You can execute the application if your data set is correctly configured, cluster data should have appeared without any error.
Happy Coding!
- Lazy Panda Tech


Loading comments...